Introduction#
DuckDB’s EXPLAIN offers valuable plan details and a rough sense of HTTP activity, but it stops short of revealing I/O timing, latency distributions, and per‑operation(eg. READ, OPEN, and LIST) behavior. For remote data access, that blind spot matters.
The observefs extension fills this gap by turning filesystem activity into actionable metrics—operation counts, latency histograms, and per‑operation stats. Paired with cache_httpfs, you can both understand and accelerate remote reads through local caching.
This post walks through filesystem observability in DuckDB and a practical caching scenario, demonstrating a measured 11.6x speedup on repeated queries.
The Problem: Invisible I/O Operations#
Consider:
SELECT COUNT(*), AVG(fare_amount)
FROM read_parquet('https://example.com/data.parquet')
WHERE fare_amount > 0;
Behind the scenes:
- Metadata fetches
- Range reads of data chunks
- Decompression/decoding
- Network latency
Key questions:
- How many requests?
- What do P50/P90/P99 IO latencies look like?
- Is caching effective?
Enter observefs#
The community observefs extension wraps DuckDB filesystems (HTTP, S3, Azure Blob, etc.) to report:
- Operation-specific metrics (READ, OPEN, LIST)
- Latency histograms and percentiles (P50–P99)
- Min/max/mean statistics
- Per-bucket breakdowns
Installation#
FORCE INSTALL observefs FROM community;
LOAD observefs;
Core Functions#
observefs_list_registered_filesystems()— list filesystemsobservefs_wrap_filesystem(name)— observefs auto-registers HTTPFileSystem, so monitoring starts immediately on load.observefs_get_profile()— fetch metricsobservefs_clear()— reset metrics
Basic Usage#
FORCE INSTALL observefs FROM community;
LOAD observefs;

-- Query remote data (monitored automatically)
SELECT count(*) FROM 'https://huggingface.co/datasets/open-r1/OpenR1-Math-220k/resolve/main/data/train-00003-of-00010.parquet';

-- Export metrics
COPY (SELECT observefs_get_profile()) TO '/tmp/output.txt';

-- Reset
SELECT observefs_clear();

-- Discover filesystems
SELECT observefs_list_registered_filesystems();

-- Wrap a filesystem (load provider first, e.g., LOAD azure;)
SELECT observefs_wrap_filesystem('AzureBlobStorageFileSystem');
What observefs_get_profile() Shows#
Includes filesystem status, operation counts, and latency distributions:
Current filesystem: observability-HTTPFileSystem
Overall latency:

open operation histogram is Max latency = 348.000000 millisec
Min latency = 0.000000 millisec
Mean latency = 116.000000 millisec
Count = 3
Distribution latency [0.000000, 10.000000) millisec: 66.666667 %
Distribution latency [340.000000, 350.000000) millisec: 33.333333 %

open operation quantile is
P50 latency 0.000000 millisec
P75 latency 174.000000 millisec
P90 latency 278.399994 millisec
P95 latency 313.199982 millisec
P99 latency 341.040009 millisec
A Real-World Use Case: Measuring Cache Impact#
Experiment Setup#
- Dataset: DuckDB job_movie_info benchmark
- File:
https://github.com/duckdb/duckdb-data/releases/download/v1.0/job_movie_info.parquet - Query:
SELECT SUM(LENGTH(info)) AS total_info_chars FROM read_parquet(...) - Result: 626,355,125 total characters
- DuckDB: v1.4.0
Scenario 1: Baseline (No Cache)#
.mode line
.timer on
FORCE INSTALL observefs FROM community;
LOAD observefs;
SELECT observefs_clear();

SELECT SUM(LENGTH(info)) AS total_info_chars
FROM read_parquet('https://github.com/duckdb/duckdb-data/releases/download/v1.0/job_movie_info.parquet');

SELECT observefs_get_profile();
Results:
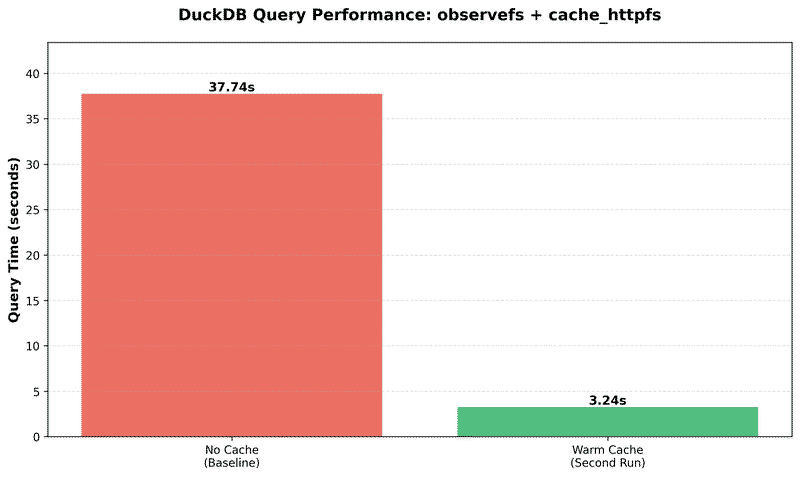
total_info_chars = 626355125
Run Time: 37.742 seconds
Observefs highlights:
- 5 open operations
- One notable connection delay (~3.5s)
- Most opens complete <10ms
Scenario 2: Warm Cache#
.mode line
.timer on
FORCE INSTALL observefs FROM community;
LOAD observefs;
FORCE INSTALL cache_httpfs FROM community;
LOAD cache_httpfs;
SET cache_httpfs_profile_type='temp';
SELECT observefs_wrap_filesystem('cache_httpfs with HTTPFileSystem');

SELECT observefs_clear();
SELECT SUM(LENGTH(info)) AS total_info_chars
FROM read_parquet('https://github.com/duckdb/duckdb-data/releases/download/v1.0/job_movie_info.parquet');

SELECT observefs_get_profile();
SELECT * FROM cache_httpfs_cache_access_info_query();
Results:
total_info_chars = 626355125
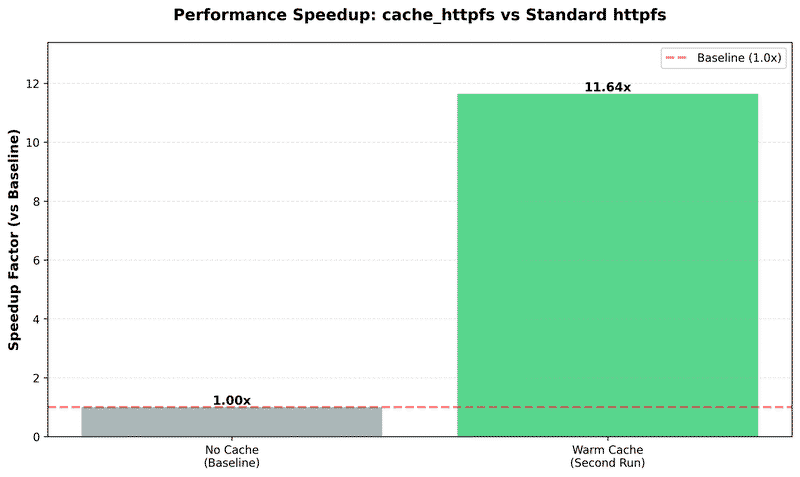
Run Time: 3.241 secondsHighlights:
- 11.64x faster than baseline (37.7s → 3.2s)
- 659 chunks served from local disk
- 91.4% latency reduction
Performance Comparison#
| Scenario | Query Time | Cached Chunks | Speedup vs Baseline |
|---|---|---|---|
| No Cache | 37.742s | N/A | 1.00x |
| Warm Cache | 3.241s | 659 | 11.64x |
Why It’s Faster#
Without cache:
Network latency → HTTP requests → Data transfer → Processing
└────────────── 37.7 seconds ────────────────┘
With warm cache:
Disk I/O (345 MB) → Processing
└──── 3.2 seconds ────┘
Observability Insights#
- Open operations include an initial connection delay.
- Most operations are sub‑10ms; long-tail latency exists on first contact.
- The file is partitioned into 659 chunks (≈345 MB).
- Repeated queries benefit by serving chunks locally.
Practical Use Cases for cache_httpfs#
- Interactive exploration: fast iterations after first read
- Cost-sensitive analytics: minimize remote reads on repeated queries
- Unreliable networks: stable performance once cached
Implementation Details#
How cache_httpfs Works#
DuckDB → cache_httpfs (Extension)
  1) Check local cache
  2) If hit → serve from disk → return data  (≈ Cache Disk 3.2s)
  3) If miss → fetch via HTTP  (≈ HTTP Network 37.7s)
  4) Check disk space
     • If insufficient → evict old entries
  5) Store object in cache → return data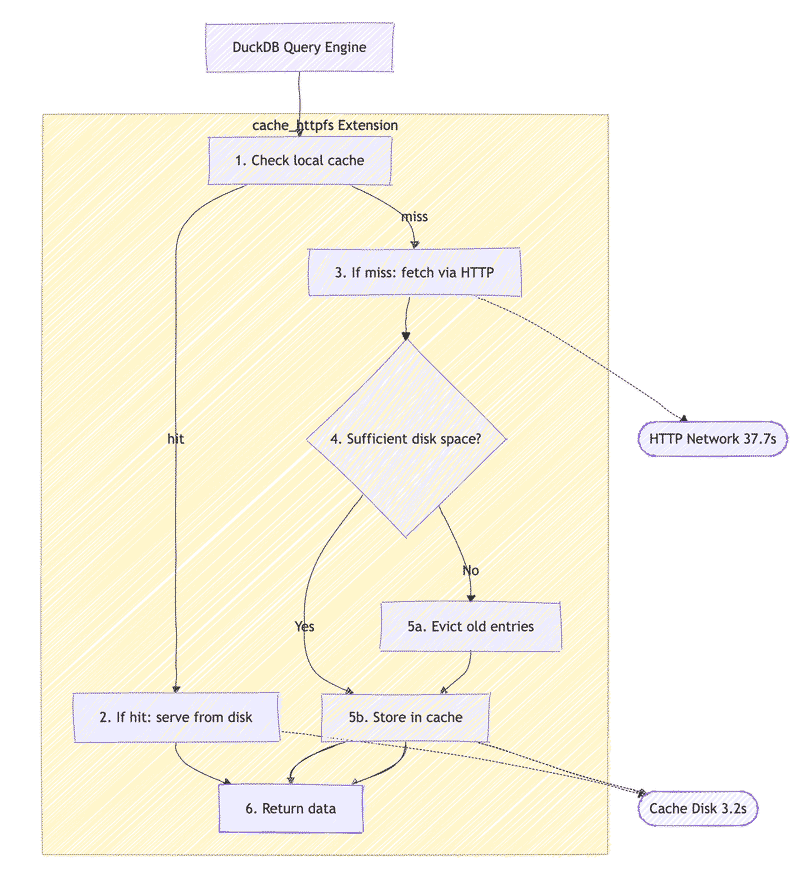
Above is on-disk cache mode (the extension supports in-memory cache mode as well), which would shows different perf characteristics
Cache Management#
Location
- Linux/macOS:
/tmp/duckdb_cache_httpfs_cache
Eviction
- In-memory: LRU
- On-disk: LRU or deadline-based
Monitoring
SELECT COUNT(*) AS cached_chunks FROM cache_httpfs_cache_status_query();
SELECT * FROM cache_httpfs_cache_access_info_query();
SELECT cache_httpfs_get_ondisk_data_cache_size();
Maintenance
-- Clear when needed
SELECT cache_httpfs_clear_cache();Conclusion#
With observefs, DuckDB’s I/O becomes transparent. Combined with cache_httpfs, repeated queries on remote data see dramatic acceleration—measured 11.6x faster with local cache and 91.4% lower latency—while observability verifies the behavior and impact end-to-end.
When to Use These Extensions#
Use cache_httpfs when:
- Access Cloud-hosted datasets(Parallel IO)
- Repeated queries(Cache)
- You can also disable caching by directory via regex
- Working in bandwidth-constrained environments
- Optimizing for cost and performance
Use observefs when:
- Debugging slow queries (identify the 3.5s connection outlier)
- Understanding I/O patterns (see the 5 open operations, 659 data chunks)
- Measuring cache effectiveness (quantify the 24.4s write penalty)
- Learning about system behavior and latency distributions (P50/P95/P99)
Resources#
- observefs Extension - Filesystem observability
- observefs GitHub - Source code and examples
- cache_httpfs Extension - HTTP caching
- cache_httpfs GitHub - Implementation details
- DuckDB Community Extensions - Full extension catalog